Debugging the ASP.NET worker process running at 100%
 A co-worker stopped by this week with a strange problem in one of our Web Applications. Sometimes I'm Chief Debugger more than Chief Architect, but I enjoy the forensics.
He found that when developing one of our web sites, the ASP.NET worker process on his machine would hang at around 100%. He'd made a few changes and couldn't check in until he figured out what was up.
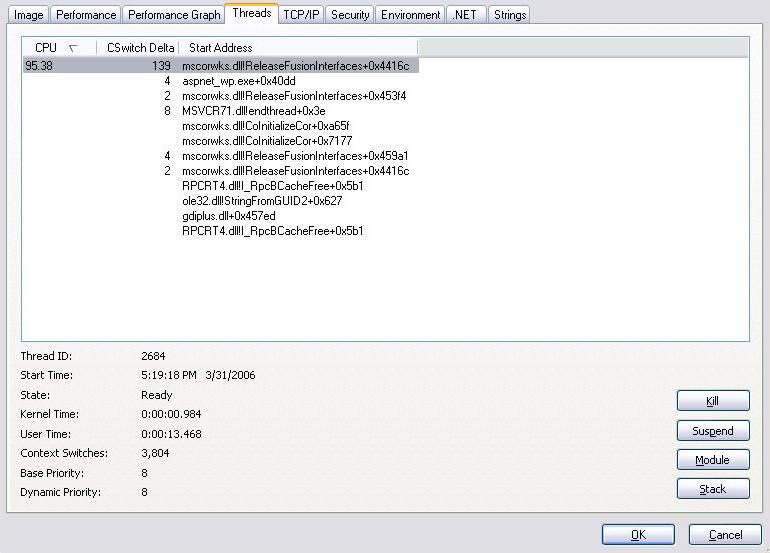 I installed Process Explorer and right-clicked on the worker process and went to the Threads Tab (a darned useful tab). It said that ReleaseFusionInterfaces was doing all the work. (I don't know the internals of the CLR to know what it's doing. Fusion is the Assembly Loader and I know what Release does. ;) I suspect that Suzanne Cook might know.) It seemed to me at this point that work WAS being done, but we were in an infinite or very long running loop.
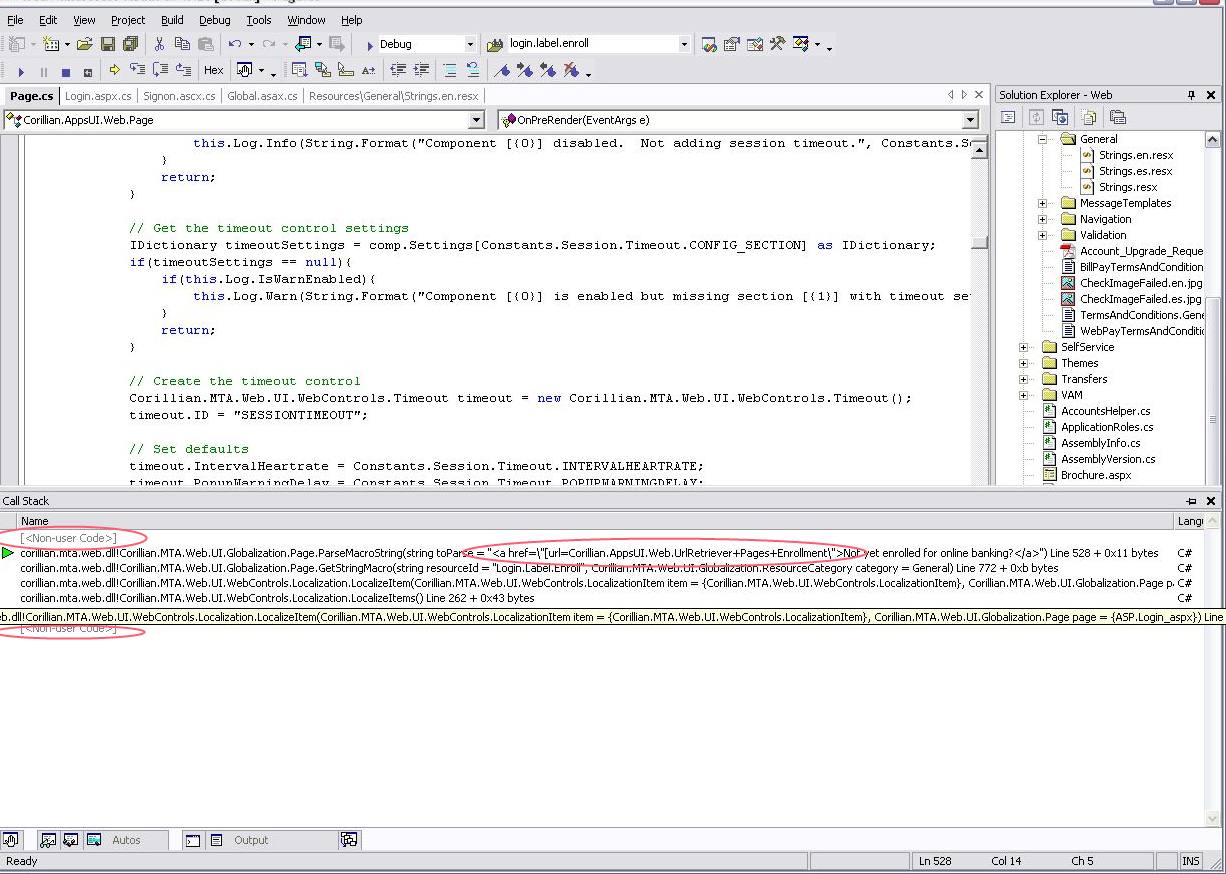 We tried selecting Debug | Break from Visual Studio.NET, but the IDE became confused and dropped into the editor with the instruction pointer (represented by a the selected yellow line) ending up inside of an XML Comment. It was totally confused.
When you select the Call Stack from the Debug Windows Menu, code that (basically) you didn't write will be marked as <Non-User Code> and hidden/collapsed within the stack view, as seen in the screenshot to the right.
As with almost all things within Windows, right-click will set you free. Right-click on everything. If you right-click within the Call-Stack Window you can select "show non-user code." and you'll see the full stack. (This is one of many places that the IDE tries to make things easier by "lying" to you. Another is the DebuggerStepThrough Attribute.)
In the final screenshot with the non-user code visible within the stack, you can see that we're stuck on RegexInterpreter.Go(). It's very possible to create Regular Expressions that will run until the Sun burns out. It may seem like we're stuck in a loop, and perhaps this Regex would have eventually finished at some point, but of course it really needs to take just a few milliseconds.
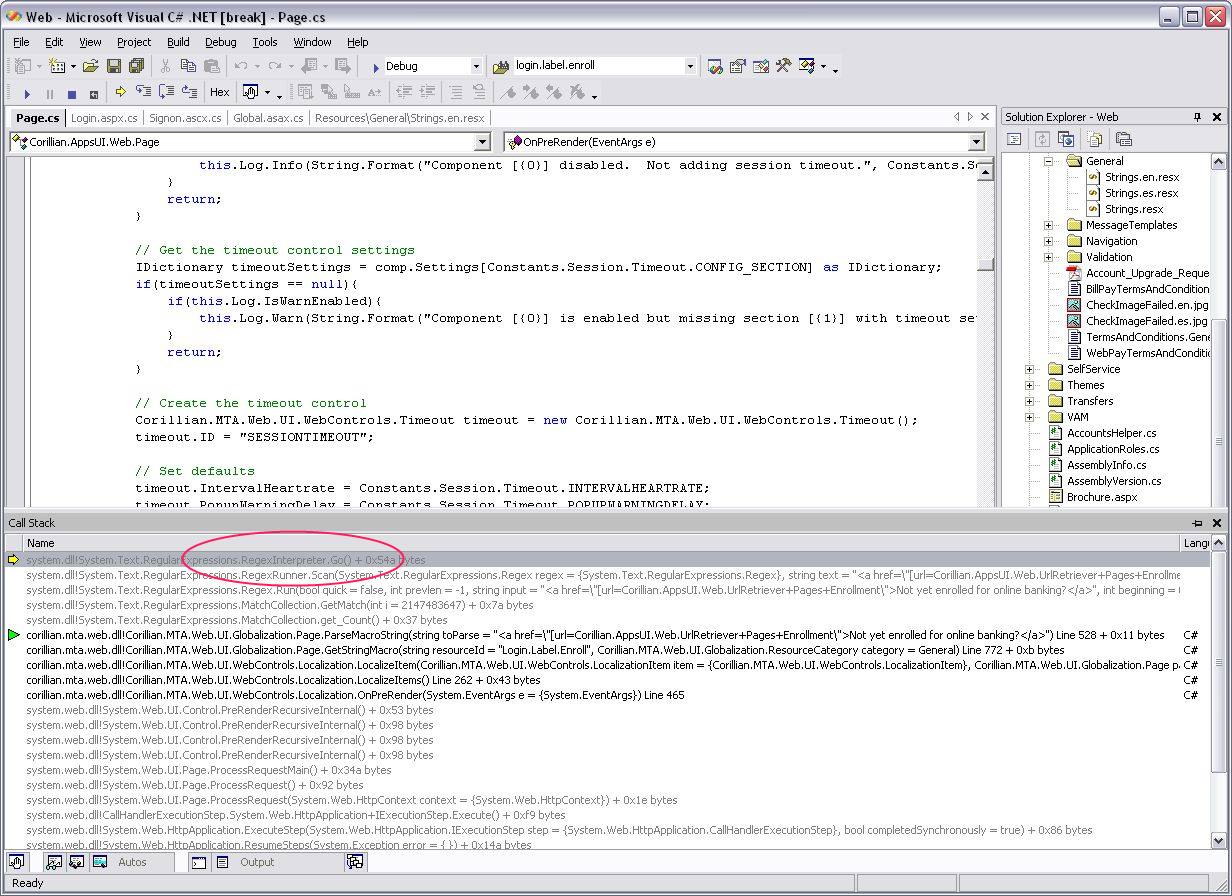 We have a layer on top of ResourceManager.GetString() that is called GetStringMacro(). Some resources might have references to other resources, using a custom "macro" format we developered. A resource might be: "For assistance call [PhoneNumber]" where PhoneNumber is another resource that we'll need to resolve with another call to GetString. The regular expression pulls the stuff embedded within []'s out.
If you look at the last sceenshot at the first/top black line, you'll notice that the string literal being passed into ParseMacroString is missing the final ] bracket. Apparently our regular expression REALLY didn't like the lack of symmetry in this string. We'll need to fix the RegEx to be more robust, but for this problem, as soon as we fixed the string, everything worked and the RegEx executed in milliseconds again.
Now playing: Rent - Goodbye Love
About Scott
Scott Hanselman is a former professor, former Chief Architect in finance, now speaker, consultant, father, diabetic, and Microsoft employee. He is a failed stand-up comic, a cornrower, and a book author.
About Newsletter

We have a very similar problem to that - I was wondering how you go about debugging itlike you have - Can you attach a debugger from a client pc and do what you have done ? Can you give me a quick explanation on hwo you debug it in VS like you did?
Thanks
Gregor


http://www.codinghorror.com/blog/archives/000464.html


Comments are closed.
First of all, notice the huge offset from ReleaseFusionInterfaces, +0x4416c. That function can't possibly be *that* large. What's actually going on, is that that function is not exported, and instead the nearest exported function is displayed.
To fix this, you need to load symbols. To do this in Process Explorer, you need to install Debugging Tools for Windows, and configure Process Explorer to use the tools' dbghelp.dll. You also need to configure a symbols path, for example, srv*c:\symbols*http://msdl.microsoft.com/download/symbols. When you've done this, Process Explorer downloads the symbols when viewing the threads. Note that this causes the GUI to become unresponsive while it's downloading the symbols.
Second, what you're viewing in the Threads tab is actually the start address. This is hardly useful when trying to figure out *what* is spending so much CPU time. If you select a thread and click the Stack button, you get a nice stack trace. The same note about downloading symbols applies here as well, but it will also temporarily suspend the thread you're getting the stack of, while it's downloading.