Exiting The Zone of Pain - Static Analysis with NDepend
 There's a great discussion going on over at Jeff Atwood's blog about Coding Smaller, modularizing properly, and refactoring often. In the comments, Jae wishes that more apps were "modularized properly," and I wholly agree.
He/she says:
I think a lot of projects are dived into too willy-nilly (especially by neophyte/ novice/ hobbyist programmers) with no pre-planning of what the thing should do and how to logically code it. [Jae]
I'll use this comment, lifted from Jeff's post, to kick of discussion here. I think that pre-planning is part of it, but there's only so much Big Design Up Front (BDUF) you can do. More and more, as I work on larger and larger projects (and product suites) I realize that refactoring effectively and often is as or more valuable as pre-planning.
There's lots of create Refactoring Tools out there, certainly Resharper and Refactor Pro leap to mind, that can help you improve your code, and to some extent, your design, with their dozens of refactorings. Both also include some code analysis tools that illustrate hotspots in your files.
<confession>
At my company, sometimes I feel less like Chief Architect, and more like Chief Debugger or Chief Code Reader. Sometimes I get to caught up in trying to read code in order to understand the big picture. This is my own failing, as I often try to use a microscope when I need a telescope.
</confession>
While trying to improve design, manage dependencies and coupling within our product suite, I've been leaning more and more on static analysis tools. Some tools are pretty UI-free, like libcheck, a tool for managing the churn of the public "surface area" of a group (or framework) of assemblies.
There's lots of tools out there for analysis of code, for many languages, all with good science behind them. I remember doing some static analysis on C++ code back in the day, but until .NET's rich meta data, doing this kind of analysis was more a parsing exercise that created Excel spreadsheets of numbers - the data just wasn't very accessible. That, combined with the fact that a lot of .NET developers now never worked in a language before .NET that enabled real solid analysis (VBScript/ASP, VB, and I don't remember a lot of MFC/C++ folks doing analysis like this) means that perhaps a majority of .NET developers haven't been introduced to the power of tools like this.
I've been spending time with NDepend more and more lately. I used it a while back when it first came out, but version 2 is out and it's giving me insight into my applications that I haven't had before.
One of the problems with applications like NDepend and static analysis apps is that they are couched in the complex or "inaccessible" language of Computer Science. Many programmers haven't gone through a formal "CompSci" program and aren't interested in an analysis application with a steep learning curve.
Like PowerShell, the first 10 minutes of NDepend is the hardest. It has to click first. There's the whole "what the hell am I looking at" process, often followed by the "screw this" declaration, followed by a quick uninstallation and a sense of "what happened."
I'm not going to even attempt to try to improve on, or replace, the good documentation that's already up on the NDepend site. One of the things that NDepend's site has lots of is screencasts, do check them out.
What I'd like to do is try to introduce some of the basics of the kinds of analyses that are possible to the average programmer or the architect who hasn't considered this kind of analysis as an important part of the development process. Additionally, I know that many of you are using FxCop as a code analysis tool. I think that NDepend intersects FxCop in some ways, but presents the data in a totally different way, and allows you to drill in so much more deeply.
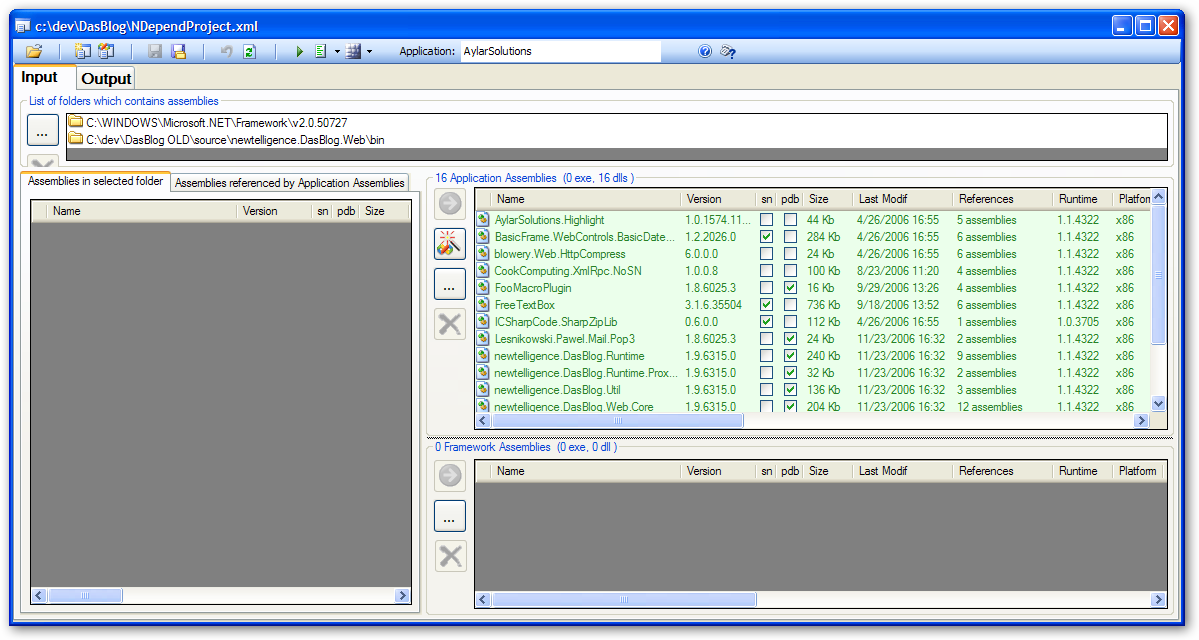
I can't use Corillian's software for my example here, so I'll use DasBlog, an ASP.NET blogging engine with which I have some association, instead. As seen in the picture below, you startup the NDepend Project application and either point it at your Visual Studio Solution, or just add your assemblies automatically. Then you save the NDepend Project as an XML file, and hit the "Play" button (the green arrow pointing to the right) and NDepend launches it's console app that chews for a while.
Next, you can either view an HTML Report - you can run the reports as often as you like and NDepend will keep a history of the reports. Using a static analysis tool can be confusing because it tells you SO much information all at once...trying to sip from the fire hose can be a challenge.
Let's start by looking at the dependency diagram that was generated by the report. These are easy to read when there is a small number of assemblies. Those of you who use Reflector Add-Ins will recognize the library style as Peli's - in fact NDepend uses the same graphics library.
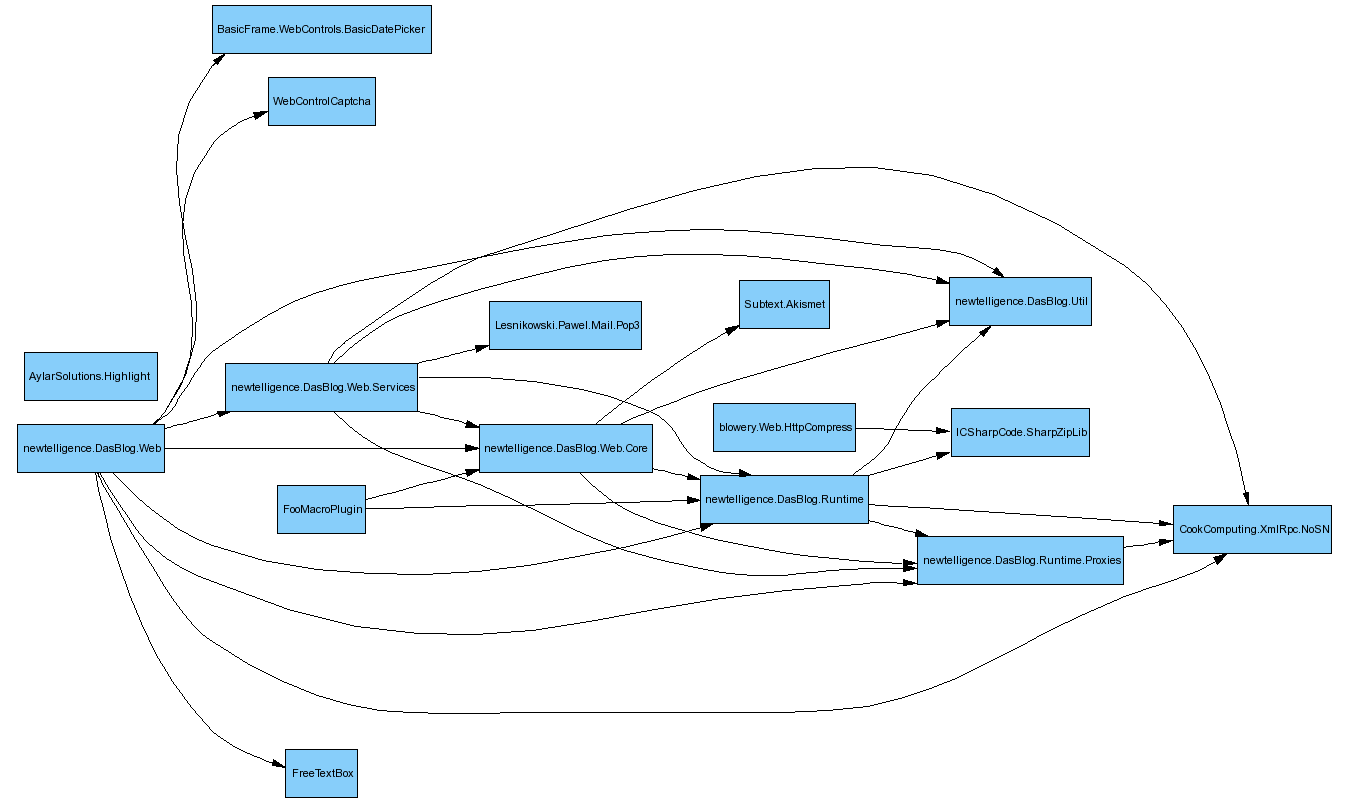
This graph is really the simplest thing that NDepend can tell you - it just scratches the surface of what this tool can do. We can learn a few important things that we may or may not have known (I didn't really grok at least) about our application.
Let's explore, for this example, the Custom Macro facilities in DasBlog and if there are design problems.
Note the "FooMacroPlugin" - it's the sample plugin that shows how to write DasBlog Custom Macros. Note that it depends on two assemblies. This exposes very clearly a lameness in the DasBlog custom Macro model - largely my fault - in that it requires a reference to two different assemblies, but Web.Core needs Runtime anyway. We can also see later that it uses concrete classes rather than Interfaces, so it's, frankly, a plugin model with problems. If DasBlog had a formal Interface assembly with defined interfaces for interacting with the system we would see different linkage.
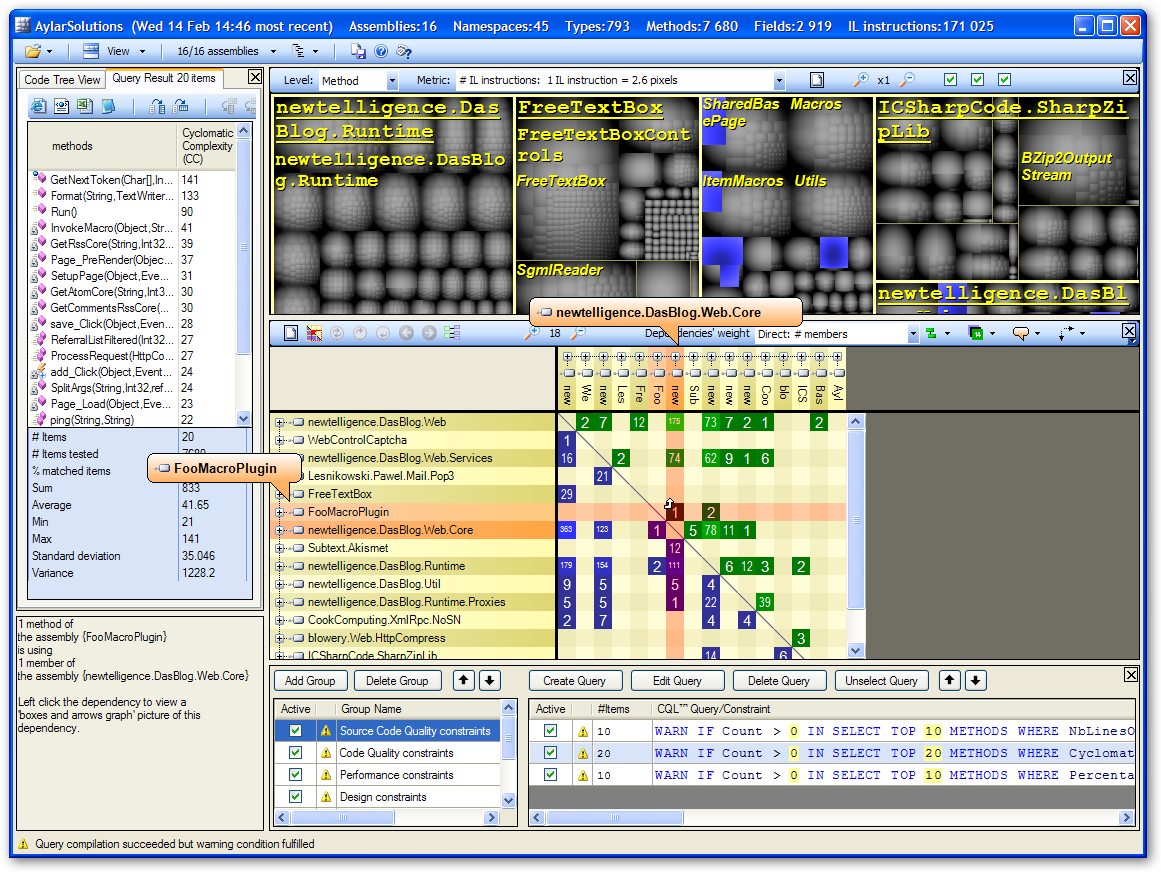
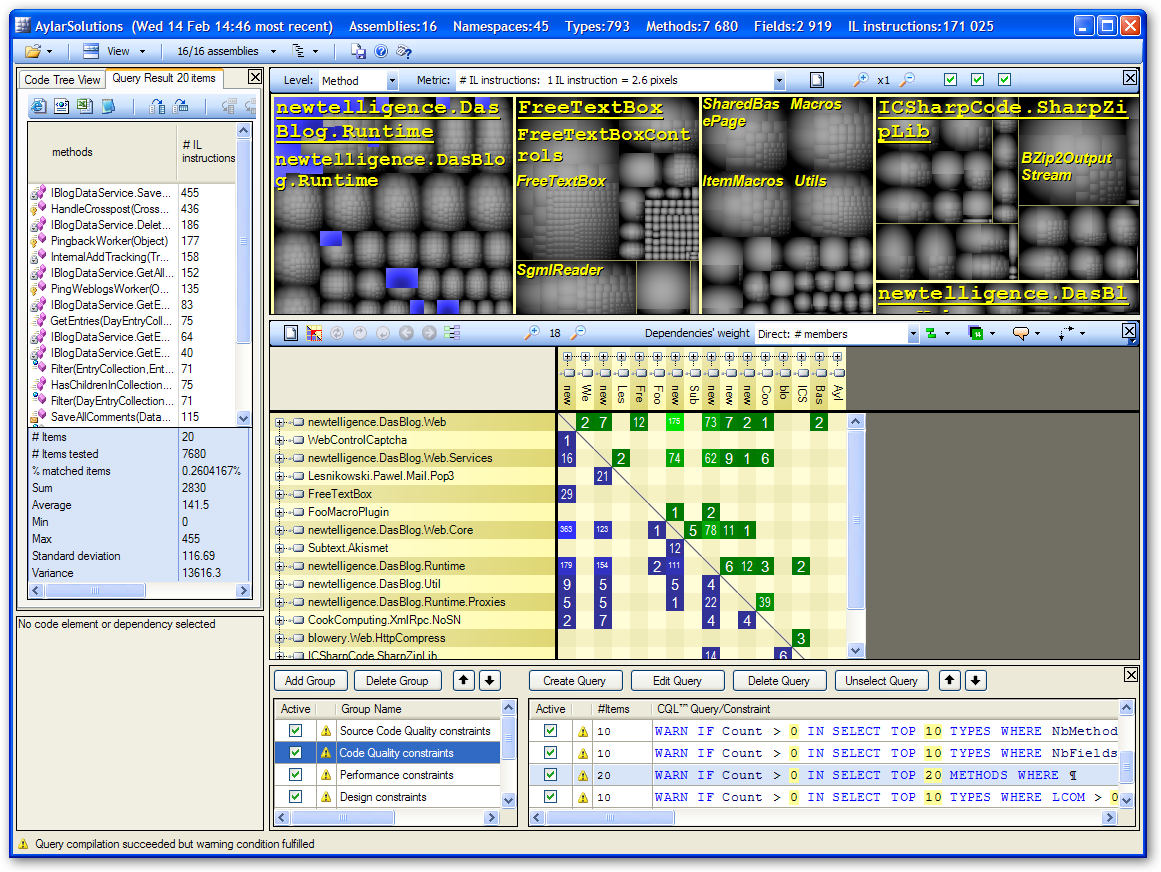
Now that we know that a custom macro links to to different assemblies, let's take a look at exactly how linked the Macro dll is to the rest of the system. We open up Visual NDepend and are barraged with a LOT of information. This is a crazy busy interface, but in that is a great deal of power. The interface is by and large modeless, and clicking in one area changes values in all the others.
In this screenshot I've clicked on the intersection in the Dependency Matrix of the FooMacroPlugin and the Web.Core assembly. Note in the lower left corner there's Plain English generated telling me "1 method of the assembly FooMacroPlugin" is using 1 member of Web.Core."
Looking along the horizontal I can see the number 1, then 2, indicating that Foomacro is using 1 method of the Core and 2 within the RunTime. (The axis can be opened up by clicking the + sign to see more text) Now I'm getting a better idea of how linked my Macros are with my other two Assemblies.
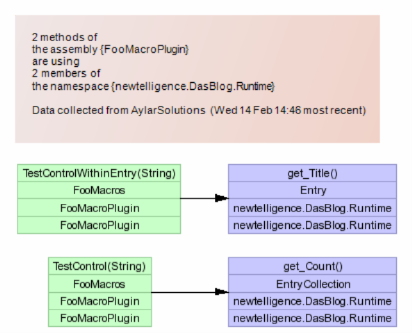
I can left-click on the number 2 to see what two methods I'm using in the Runtime. A "boxes and arrows" diagram is generated telling me that my Macros (there are two in FooMacroPlugin) are calling into a property on the an Entry (a blog Entry) and getting the count of an EntryCollection.
Now I'm starting to see what the impact would be if I were to refactor the Macro plugin mechanism in DasBlog, and I would repeat this analysis on a more complex Custom Macro, probably from the community. Even better, I could drop in EVERY custom Macro I could find to get a really 20,000 foot view - a wide perspective - on how Macros are being used...without reading the code.
NDepend really shines in it's use of CQL - Code Query Language - an NDepend invention, but public spec. Basically it's SQL for Reflection. I can write queries using this SQL-like syntax to ask questions about assemblies, types, methods, whatever within my solution. Here's some examples:
Detect Unused Methods:
WARN IF Count > 0 IN SELECT TOP 10 METHODS WHERE MethodCa == 0 AND !IsPublic AND !IsEntryPoint AND !IsExplicitInterfaceImpl AND !IsClassConstructor AND !IsFinalizer
I ran this CQL query without the "TOP 10" qualifier on some code on one project and found 292 methods that weren't being used.
Detect Overly Complicated Methods
WARN IF Count > 0 IN SELECT TOP 10 METHODS WHERE
( NbILInstructions > 200 OR
ILCyclomaticComplexity > 50 OR
NbParameters > 5 OR
NbVariables > 8)
AND
// Here is a way to avoid to take account of generated methods.
// Another way would be to use the SELECT METHODS FROM or SELECT METHODS OUT OF facilities.
!( NameLike "InitializeComponent" OR NameLike "Generated")
Here's a great one. This gives methods that have over 200 instructions or a complexity of over 50 (REALLY complex), or have too many variables or parameters, but includes a trick to exclude both generated code and that crap that the WinForms designer creates in InitializeComponent.
These are just some of the dozens of rules and examples that it includes. I personally find writing this kind of CQL to be WAY more intuitive and flexible than writing FxCop rules/plugins.
If you select any CQL query, it runs instantly as you select it and the Tree Map at the top updates automatically, lighting up the result of the query. The toolbox in the upper left corner shows the result of the query in a table. You can then click on any of the methods and NDepend will open Visual Studio and take you there.
The TreeMap in the diagram below acts like a "heat map" showing the hot spots discovered. The blue area on the left side of the map shows the methods that came back as a result of my query. Above the TreeMap is a combo box that indicates what metric the TreeMap is using to determine the size of the squares. In this screen shot I'm using # of IL instructions so the larger the square, the more instructions. I could use lines of code, or cyclomatic complexity, or whatever to find the "fat" parts of my application.
CQL queries can these can include "WARN" at the beginning so they can be used within a Continuous Integration build. NDepend includes a NAnt Task and an MSBUILD Task, as well as stylesheets and plugins for Cruise Control.NET so I can add constraints to keep our applications in line as changes are checked in. The rules (the CQL) is really easy to read and the editor includes intellisense.
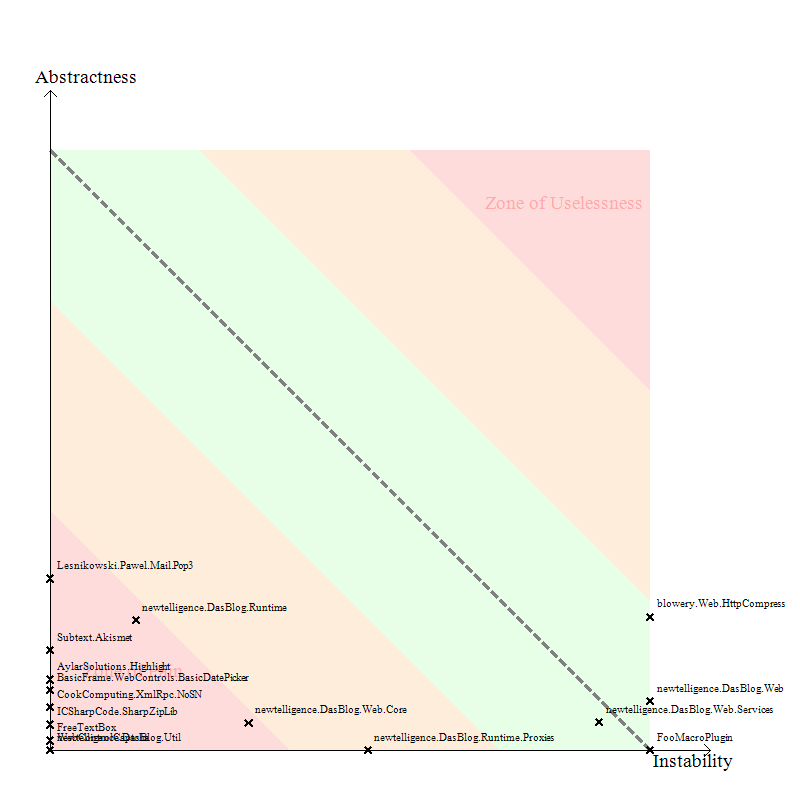
Another nice diagram that is produced by NDepend is the chart of Abstractness vs. Instability. It says a lot, and it's easy to take the data as a value judgement directed towards your code. As if your assembly appears in Red, you're a Bad Person.

The Y-axis indicates how Abstract your assembly is - that is, is it able to be extended without recompile. The X-axis is instability. Now, "instability" carries a value judgement in itself. They aren't saying that stable is good and instable isn't. Stable means that the public surface area of your assemblies "can't" change because there are a lot of assemblies that are dependent on it. An instable assembly has fewer, or no, dependant assemblies upstream. Take a look at Page 8 of this document on Principles of Package Design. A number between 0 and 1 is assigned for each axis based on those equations and your assembly is plotted accordingly.
Here's the trick in reading the chart:
- If an assembly is very stable (that is, lots of folks depend on it) and it's not extensible (no abstract classes, no virtuals, etc) then you're in the lower-left quadrant of the chart in the well-named Zone of Pain.
- If an assembly is very abstract, very extensible, but no one depends on it (it's not really being used) then it moves towards the Zone of Uselessness.
Notice how many of the assemblies are in the Zone of Pain? So many, in fact, that you can't even read the words Zone of Pain any more. If you read the assembly names, you'll see that the ones that have made their way over into that portion of the chart are most of the 3rd party assemblies we use. This makes sense because these assemblies are Stable - lots of folks depend on them - and they were designed for some specific function, not for extensibility. Over there are things like the SharpZip lib, the FreeTextBox, and SubText's Akismet library. Is it bad that there are libraries over there? It's less something to panic about then it is something to have increased awareness about. Charts like this can give you a lot of insight into how hard it would be to replace a 3rd party component if you needed, or just to extend one. Here's a screencast on doing an impact analysis on replacing a 3rd party component within NDepend itself.
We can also note that both the DasBlog Runtime and Web.Core assemblies are edging their way over into the Zone of Pain. That implies that more and more we are depending on those assemblies in unhealthy ways because they aren't well-factored for use by both the application itself and the Plugins. All this equals opportunity to possibly modify our design.
I will point out, just as a bit of interest, that when Patrick and I ran this same chart on Corillian's Voyager SDK - an SDK that has had more eyes on it, perhaps, than DasBlog - we had only one assembly in the "Zone of Pain" and none in the Zone of Uselessness. We felt OK about that.
Wrap up
I'm really just touching on the beginnings over what a good static analysis tool can do. But you have to integrate a tool like this not only into your life, but into your build process and your company's software development process. You can't just drop the tool into your word and expect instant results. If you have a fairly mature process - agile or not - and developers who are enthusiastic to this kind of very hard-numbers input, you can begin by integrating this data into your existing code reviews. Start up a working group or study group to talk about what the information means - you don't even need to take action, just talk amongst peers. After your team starts to get a sense of where the metrics are not only taking them, but when to ignore the metrics and why, then you can start adding custom queries and warnings and integrating them into your continuous build.
NOTE: One last thing, to be clear. I don't know the guy from NDepend personally. I did chat him on Skype to answer some of my more esoteric questions. I'm not paid for being a reviewer of this product, in this case I'm just a massive FanBoy, much like I am about CodeRush. Neither of them has ever given me a penny.
I'm writing this because I want folks to think about their designs, not just up front, but all through the design...before, during, after. Think about complexity, think about supportability. Realize that your code, your app, your suite is very likely more complex than can be held in your head, and if you take the time - both in your day, and scheduled into your project - to review your design, truly understand what's going on, and use your analysis to make substantive changes to improve the quality of your company's code. Tools like NDepend or one of the many code analysis tools out there like Lattix, can really give you a great deal of insight and perspective on how your applications fit together, if you just take a few hours to get over the initial "hump of difficulty."
Once I realized the depth and breadth of the information I was looking at it, I was like a kid in a candy shop. It was the first time I discovered JetBrains dotTrace profiler - "and now I can see."
Go check out NDepend. There is a FREE/ACADEMIC version that you can try out and use on your Open Source apps, and the full Pro Version is about US$400 with steep discounts if you buy in quantity. Most companies would only need 1 or 2 copies for a lead "code analyst" I think, so it's reasonably priced. Run it on your companies application and show your boss a few graphs - and explain what he's looking at - and I'm sure he or she will give you the money. ;) I recommend trying to stay out of the Zone of Pain.
About Scott
Scott Hanselman is a former professor, former Chief Architect in finance, now speaker, consultant, father, diabetic, and Microsoft employee. He is a failed stand-up comic, a cornrower, and a book author.
About Newsletter


Instead, we plan to create another build that runs nightly just for NDepend so we get the benefit of the report, but it doesn't bog down checkins.
Also, for those extra long coding section, I recommend NDepends.
(sorry couldn't resist).


You should see my post (http://jayflowers.com/WordPress/?p=101) "AsyncExec and WaitForExit: Speeding Up The Build To Do More". You can get the source from here (http://ci-factory.googlecode.com/svn/Current/Product/Production/Nant/CIFactory.NAnt.Tasks/Tasks/). Since the post I have migrated the tasks to C#, I have not updated the links in the posts yet.
These tasks will let you run things like NDepend asynchronously from the rest of the build.

Great read. Posted on the same topic a while ago (http://dotnet.org.za/cjlotz/archive/2007/01/02/Code-Metrics.aspx) and also found NDepend to be the best tool for the job. A reader alerted me to another tool, NStatic (http://wesnerm.blogs.com/net_undocumented/nstatic/index.html) that looks quite promising as well.

In your pod cast on the same subject you pine for Mark Miller to team up with Patrick Smacchia. I would add in Lutz Roeder and Jamie Cansdale. That would be to die for...
Anyway it is still early for CodeIt.Right. It looks to be along the lines of what you want.
http://submain.com/?nav=products.cir
A lot of what you talked about reminded me of working for PR:QA in the UK fifteen years ago. We had "QA Fortran" and "QA C" products back then that did exactly this sort of analysis (for Fortran and C code - duh!). I wrote the core of the C product (originally as the first ANSI-validated C compiler - which PR:QA then licensed) and then wrote a C++ analyzer for them (called "QA C++" of course) while I was on the C++ Standards Committee. Since I left the company in the mid-90's they have added a Java product and a few other tools. They don't seem to have a C# product (yet?).
The C++ product computed stuff like the Lack Of Cohesion metric (and many, many others) and included graphical visualization of code structure as well as data analysis of the metrics.
Selling the products in Europe and Japan was pretty easy (especially in Japan where they are *very* quality conscious) but this stuff was always a really hard sell in America. I guess we were somewhat ahead of our time for the U.S. market?
Check out the product datasheets at http://www.programmingresearch.com/ which show some screen shots.
Since I moved to the U.S. in '99 I have heard anyone talk much about static analysis so your show really was a breath of fresh air - I'd love to see more people take this stuff seriously over here!

Check it out at
http://semmle.com
[Disclosure: I am a prof at Oxford working on static analysis tools, and the CEO of Semmle]

While CQL has been proven to be adapted to real-world needs, .QL allows to go a bit beyond CQL because of its object model. We are glad to announce that we are working on a CQL over LINQ language (+ a CQL to CQL/LINQ automatic converter). CQL will then benefit from the tremendous power of LINQ (aggregation, composition, join, static typing…) + the power of the current CQL (metrics, dependencies, all CTS peculiarities handled, optimiwed and real-time execution…).
We are enthusiast about Semmle. The more products will support this kind of paradigm, the more people will get educated and the better their architecture and code will be. Welcome to Semmle!
Indeed NDepend and SemmleCode are complementary, and they have quite different emphasis.
In the initial development of SemmleCode, our primary emphasis has been on making it extremely scalable (by storing the libraries and program in a relational database), and also on the query language .QL and its optimising compiler. For instance, quite sophisticated analyses are done to give warnings for queries that will not return any result, and also to produce efficient querying code from simple declarative statements.
We're working on providing a library of common queries, especially for metrics. Look for instance at
http://semmle.com/component/option,com_smf/Itemid,26/topic,3.0/
to see how easy it is to express fairly complex notions such as "Lack of Cohesion in Methods".
At Semmle we also think querying multiple versions is very important. Coming up soon! We're hopeful all the work on scalability will pay off there.
Yep, let's show the world how much they need tools like NDepend and SemmleCode.
Comments are closed.
It works on VB based projects (Classic VB, VBA and VB.Net). The demo works on small projects (under 10 modules). Otherwise, it is quite reasonably priced.