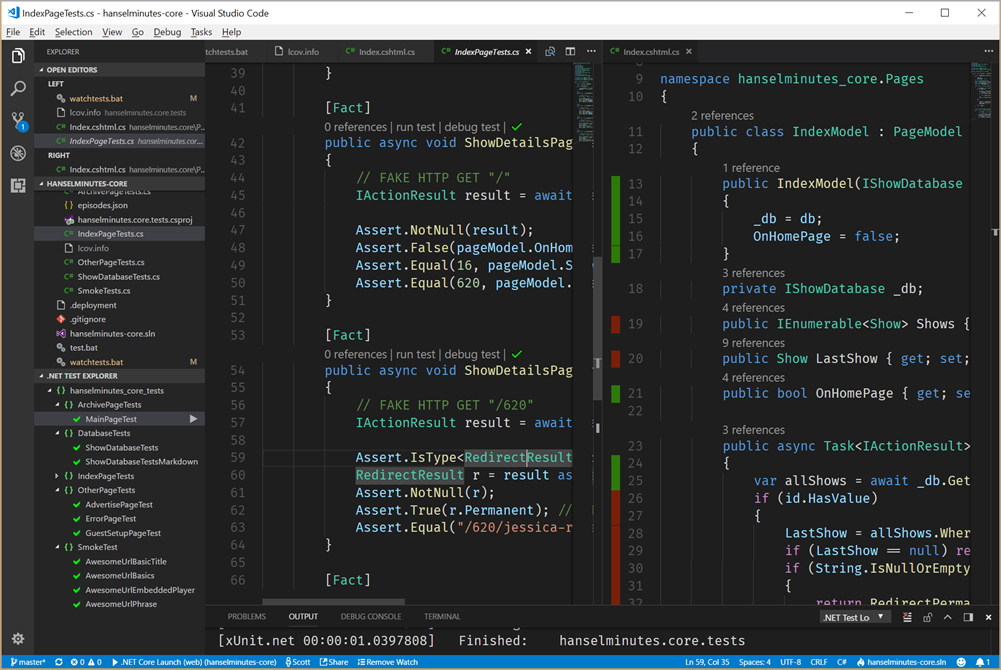
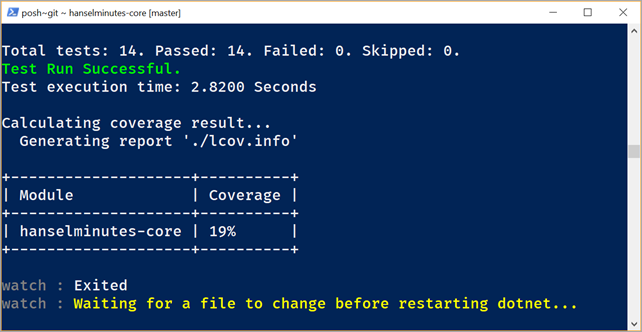
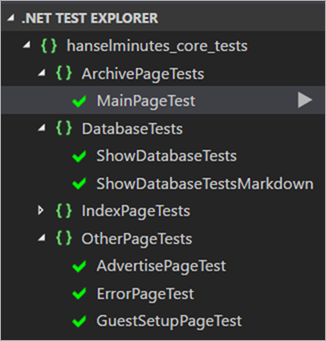
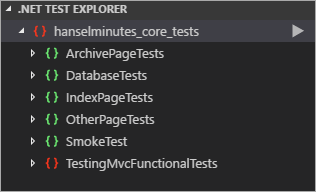
 In ASP.NET 2.1 (now in preview) there's apparently a new package called Microsoft.AspNetCore.Mvc.Testing that's meant to help streamline in-memory end-to-end testing of applications that use the MVC pattern. I've been re-writing my podcast site at https://hanselminutes.com in ASP.NET Core 2.1 lately, and recently added some unit testing and automatic unit testing with code coverage. Here's a couple of basic tests. Note that these call the Razor Pages directly and call their OnGet() methods directly. This shows how ASP.NET Core is nicely factored for Unit Testing but it doesn't do a "real" HTTP GET or perform true end-to-end testing.
These tests are testing if visiting URLs like /620 will automatically redirect to the correct full canonical path as they should.
[Fact]
public async void ShowDetailsPageIncompleteTitleUrlTest()
{
    // FAKE HTTP GET "/620"
    IActionResult result = await pageModel.OnGetAsync(id:620, path:"");

    RedirectResult r = Assert.IsType<RedirectResult>(result);
    Assert.NotNull(r);
    Assert.True(r.Permanent); //HTTP 301?
    Assert.Equal("/620/jessica-rose-and-the-worst-advice-ever",r.Url);
}

[Fact]
public async void SuperOldShowTest()
{
    // FAKE HTTP GET "/default.aspx?showId=18602"
    IActionResult result = await pageModel.OnGetOldShowId(18602);

    RedirectResult r = Assert.IsType<RedirectResult>(result);
    Assert.NotNull(r);
    Assert.True(r.Permanent); //HTTP 301?
    Assert.StartsWith("/615/developing-on-not-for-a-nokia-feature",r.Url);
}
I wanted to see how quickly and easily I could do these same two tests, except "from the outside" with an HTTP GET, thereby testing more of the stack.
I added a reference to Microsoft.AspNetCore.Mvc.Testing in my testing assembly using the command-line equivalanet of "Right Click | Add NuGet Package" in Visual Studio. This CLI command does the same thing as the UI and adds the package to the csproj file.
dotnet add package Microsoft.AspNetCore.Mvc.Testing -v 2.1.0-preview1-final
It includes a new WebApplicationTestFixture that I point to my app's Startup class. Note that I can take store the HttpClient the TestFixture makes for me.
public class TestingMvcFunctionalTests : IClassFixture<WebApplicationTestFixture<Startup>>
{
    public HttpClient Client { get; }

    public TestingMvcFunctionalTests(WebApplicationTestFixture<Startup> fixture)
    {
        Client = fixture.Client;
    }
}
No tests yet, just setup. I'm using SSL redirection so I'll make sure the client knows that, and add a test:
public TestingMvcFunctionalTests(WebApplicationTestFixture<Startup> fixture)
{
    Client = fixture.Client;
    Client.BaseAddress = new Uri("https://localhost");
}

[Fact]
public async Task GetHomePage()
{
    // Arrange & Act
    var response = await Client.GetAsync("/");

    // Assert
    Assert.Equal(HttpStatusCode.OK, response.StatusCode);
}
This will fail, in fact. Because I have an API Key that is needed to call out to my backend system, and I store it in .NET's User Secrets system. My test will get an InternalServerError instead of OK.
Starting test execution, please wait...
[xUnit.net 00:00:01.2110048]   Discovering: hanselminutes.core.tests
[xUnit.net 00:00:01.2690390]   Discovered:  hanselminutes.core.tests
[xUnit.net 00:00:01.2749018]   Starting:    hanselminutes.core.tests
[xUnit.net 00:00:08.1088832]     hanselminutes_core_tests.TestingMvcFunctionalTests.GetHomePage [FAIL]
[xUnit.net 00:00:08.1102884]       Assert.Equal() Failure
[xUnit.net 00:00:08.1103719]       Expected: OK
[xUnit.net 00:00:08.1104377]       Actual:   InternalServerError
[xUnit.net 00:00:08.1114432]       Stack Trace:
[xUnit.net 00:00:08.1124268]         D:\github\hanselminutes-core\hanselminutes.core.tests\FunctionalTests.cs(29,0): at hanselminutes_core_tests.TestingMvcFunctionalTests.<GetHomePage>d__4.MoveNext()
[xUnit.net 00:00:08.1126872]         --- End of stack trace from previous location where exception was thrown ---
[xUnit.net 00:00:08.1158250]   Finished:    hanselminutes.core.tests
Failed   hanselminutes_core_tests.TestingMvcFunctionalTests.GetHomePage
Error Message:
 Assert.Equal() Failure
Expected: OK
Actual:   InternalServerError
Where do these secrets come from? In Development they come from user secrets.
public Startup(IHostingEnvironment env)
{
    this.env = env;
    var builder = new ConfigurationBuilder();

    if (env.IsDevelopment())
    {
        builder.AddUserSecrets<Startup>();
    }
    Configuration = builder.Build();
}
But in Production they come from the ENVIRONMENT. Are these tests Development or Production...I must ask myself. They are Production unless told otherwise. I can override the Fixture and tell it to use another Environment, like "Development." Here is a way (given this preview) to make my own TestFixture by deriving and grabbing and override to change the Environment. I think it's too hard and should be easier.
Either way, the real question here is for me - do I want my tests to be integration tests in development or in "production." Likely I need to make a new environment for myself - "testing."
public class MyOwnTextFixture<TStartup> : WebApplicationTestFixture<Startup> where TStartup : class
{
    public MyOwnTextFixture() { }

    protected override void ConfigureWebHost(IWebHostBuilder builder)
    {
        builder.UseEnvironment("Development");
    }
}
However, my User Secrets still aren't loading, and that's where the API Key is that I need.
BUG?: There is either a bug here, or I don't know what I'm doing. I'm loading User Secrets in builder.AddUserSecrets<Startup> and later injecting the IConfiguration instance from builder.Build() and going "_apiKey = config["SimpleCastAPIKey"];" but it's null. The config that's injected later in the app isn't the same one that's created in Startup.cs. It's empty. Not sure if this is an ASP.NE Core 2.0 thing or 2.1 thing but I'm going to bring it up with the team and update this blog post later. It might be a Razor Pages subtlety I'm missing.
For now, I'm going to put in a check and manually fix up my Config. However, when this is fixed (or I discover my error) this whole thing will be a pretty nice little set up for integration testing.
I will add another test, similar to the redirect Unit Test but a fuller integration test that actually uses HTTP and tests the result.
[Fact]
public async Task GetAShow()
{
    // Arrange & Act
    var response = await Client.GetAsync("/620");

    // Assert
    Assert.Equal(HttpStatusCode.MovedPermanently, response.StatusCode);
    Assert.Equal("/620/jessica-rose-and-the-worst-advice-ever",response.Headers.Location.ToString());
}
There's another issue here that I don't understand. Because have to set Client.BaseAddress to https://localhost (because https) and the Client is passed into fixture.Client, I can't set the Base address twice or I'll get an exception, as the Test's Constructor runs twice, but the HttpClient that's passed in as a lifecycler that's longer. It's being reused, and it fails when setting its BaseAddress twice.
Error Message:
 System.InvalidOperationException : This instance has already started one or more requests. Properties can only be modified before sending the first request.
BUG? So to work around it I check to see if I've done it before. Which is gross. I want to set the BaseAddress once, but I am not in charge of the creation of this HttpClient as it's passed in by the Fixture.
public TestingMvcFunctionalTests(MyOwnTextFixture<Startup> fixture)
{
    Client = fixture.Client;
    if (Client.BaseAddress.ToString().StartsWith("https://") == false)
        Client.BaseAddress = new Uri("https://localhost");
}
Another option is that I create a new client every time, which is less efficient and perhaps a better idea as it avoids any side effects from other tests, but also feels weird that I should have to do this, as the new standard for ASP.NET Core sites is to be SSL/HTTPS by default..
public TestingMvcFunctionalTests(MyOwnTextFixture<Startup> fixture)
{
    Client = fixture.CreateClient(new Uri(https://localhost));
}
I'm still learning about how it all fits together, but later I plan to add in Selenium tests to have a full, complete, test suite that includes the browser, CSS, JavaScript, end-to-end integration tests, and unit tests.
Let me know if you think I'm doing something wrong. This is preview stuff, so it's early days!
Sponsor: Get the latest JetBrains Rider for debugging third-party .NET code, Smart Step Into, more debugger improvements, C# Interactive, new project wizard, and formatting code in columns.
Hosting By

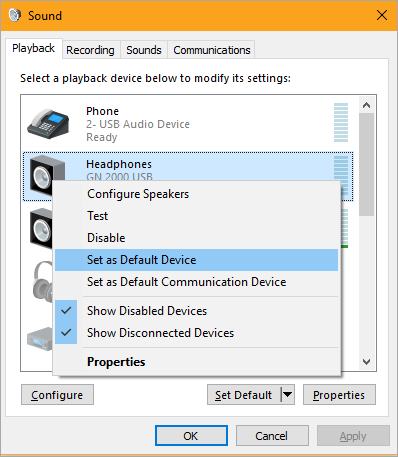
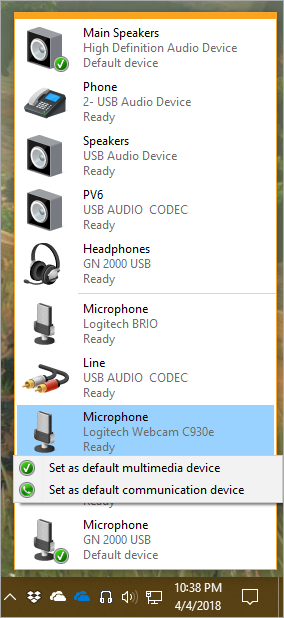
 I've been running a podcast now for over 600 episodes and I do most of my recordings here at home using a Peavey PV6 Mixing Console - it's fantastic. However, I also work remotely and use Skype a lot to talk to co-workers. Sometimes I use a USB Headset but I also have a Polycom Work Phone for conference calls. Plus my webcams have microphones, so all this adds up to a lot of audio devices.

 In ASP.NET 2.1 (now in preview) there's apparently a new package called
